What one team found when they finally mapped their approval flows
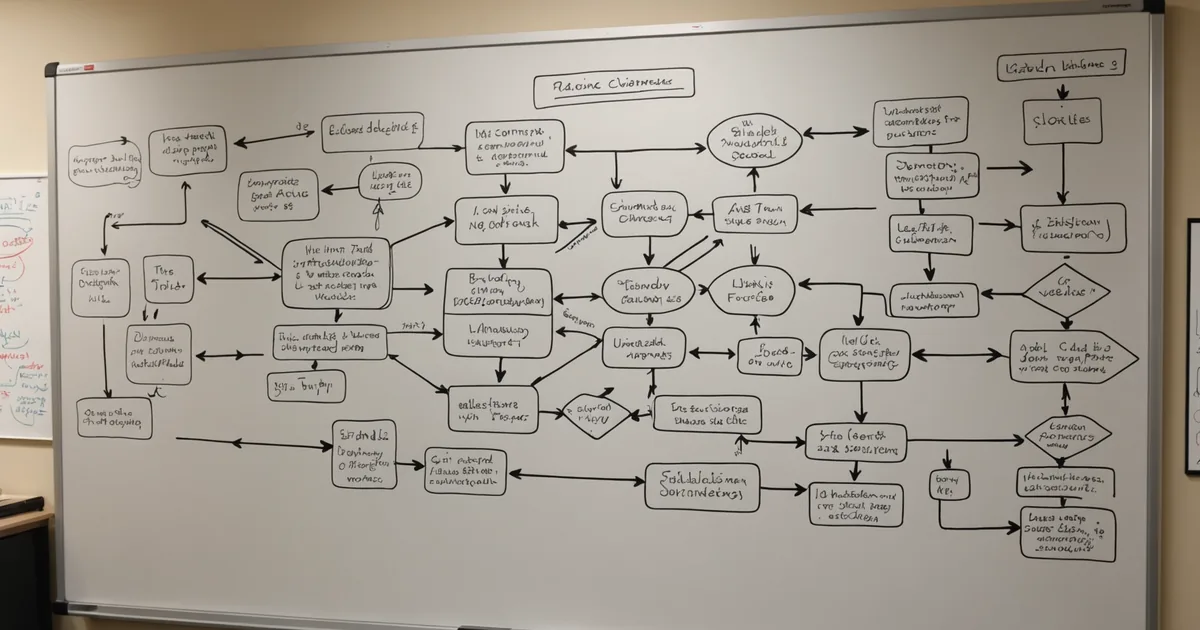
The operations team at a regional professional services firm had three approval workflows they considered "fine." Not fast, not great, but functional. The purchase approval process had been running for six years. The project staffing approval was three years old. The client proposal sign-off process had been assembled gradually as the firm grew and nobody had ever taken a complete look at it.
When they connected Fluency to their project management system and ERP in late 2025, the intent was modest: confirm that automation was worth pursuing before committing a budget to a vendor. The CFO wanted numbers before greenlighting anything. What came back from the initial workflow audit was not what anyone expected.
What the data showed
The purchase approval workflow had four documented steps. The Fluency audit found eleven distinct states the workflow actually passed through, including two rework loops that existed nowhere in the process documentation. Average cycle time was 8.3 days. The documented process assumed 2 days.
The staffing approval process was faster on paper than in practice by a factor of four. Work was entering the workflow, moving through one or two steps, and then sitting. Not because anyone was blocking it deliberately, but because the handoff between the project manager and the resourcing team happened through email, and there was no system record of when a handoff had occurred or whether it had been acknowledged. Items sat in inboxes. Escalation was informal and inconsistent. The workflow data surfaced that 34% of staffing requests were in a "pending acknowledgment" state for more than three business days before anyone knew to follow up.
The client proposal process was the surprise. The team knew it felt slow. What they did not know was the number of parallel paths that had developed organically. Depending on which senior partner was in the approval chain, a proposal might touch between three and nine distinct approval events before it went to the client. The nine-event path took an average of fourteen days. The three-event path averaged two and a half days. The firm had no mechanism to see which proposals were on which path, or why.
Translating cycle time into cost
Cycle time data is interesting. Cost data is what moves a budget conversation.
The team calculated the cost of each workflow using three inputs Fluency made available: average hourly loaded cost per role involved, median cycle time, and transaction volume over the prior twelve months. For the purchase approval process, the annual cost of the approval cycle itself, not the underlying purchases, but the act of approving them, came to approximately $118,000. That figure accounted for the time of everyone who touched each transaction: the requestor, the approvers, the finance team member who processed it afterward, and the periodic re-approvals triggered when requests went stale.
The staffing approval process cost was harder to isolate because delay had a knock-on effect on project starts. When staffing approval ran four days instead of one, project kick-offs shifted. The team estimated the cost of delayed starts conservatively, accounting only for utilisation impact that was directly traceable to late approvals. That number was $74,000 annually.
The proposal approval process had a more direct cost calculation: proposals on the nine-event path had a measurably lower close rate than those on the three-event path, even after controlling for proposal value and client type. The team did not attempt to convert this to a hard dollar figure because the causal chain was not clean enough to defend to finance. What they did note was the fourteen-day path and flagged it as a quality problem regardless of dollar value.
What changed, and what did not
The team brought three findings to the CFO. Two of the three resulted in immediate budget approvals.
The purchase approval workflow was the clearest case. The two rework loops were caused by incomplete information at the point of request submission. The fix was partly process redesign (a revised intake form with mandatory fields) and partly automation (a validation step that checked completeness before routing to the first approver). Estimated savings from eliminating rework and reducing average cycle time from 8.3 days to an estimated 2.5 days: $67,000 annually, payback in under five months.
The staffing process fix was simpler than expected. The handoff gap was real, but it did not require a new tool. The team added a system-recorded handoff acknowledgment step in their project management platform and set an automated escalation flag at 48 hours with no acknowledgment. The improvement was not an automation of the work itself, just of the visibility around it. Fluency's post-implementation data showed the "pending acknowledgment" percentage drop from 34% to 6% within eight weeks.
The proposal process was not approved for automation. The variability in approval paths turned out to reflect genuine differences in proposal complexity and partner relationship history. Automating it would have required standardising something that the senior leadership did not want standardised. What the team did instead was create a routing rule that flagged proposals approaching day eight in the approval cycle for a specific check-in. Not a fix, but a useful pressure valve.
The part that is not a success story
The audit also surfaced a fourth workflow the team had not prioritised: the client onboarding process. The data here was uncomfortable. Average time from signed contract to first project meeting was 17 days. The documented target was 7. The delay was distributed across three different teams and three different systems, with no single owner for the end-to-end process.
The team chose not to address this in the first automation cycle because the process crossed so many ownership boundaries that fixing it properly would have required organisational changes, not just workflow improvements. It is in the queue for the next round. That is a legitimate outcome: knowing which processes are automation candidates and which are organisational design problems is itself useful information, and it prevents teams from spending automation budget on problems that cannot be automated out of existence.
What the exercise confirmed
The firm's operations director described the value of the exercise in terms that are worth repeating: they had assumed for years that the approval processes were roughly as described in their documentation. The assumption was wrong by a factor of three to four on cycle time, and wrong by omission on cost. Those assumptions had been used to reject automation proposals in previous years on the grounds that the processes were "basically working."
The distinction between a process that is "basically working" and a process whose actual performance has been measured is important. Most operations teams are in the first category for most of their processes. The gap between those two states is where automation ROI comes from.
Mapping approval flows is not a glamorous exercise. It involves connecting systems, waiting for data, and then working through numbers that are often uncomfortable to look at. What it produces, at the end, is a clear picture of where time and money are going, which of those costs are reducible, and what the reduction is actually worth. That is what a CFO needs to see before approving a budget. It is what operations leaders need to see before choosing which process to fix first.
The team is now in their second audit cycle, looking at four more workflows. The first audit paid for the tool subscription several times over before the end of Q1 2026.